Introduction
In 2015, Spotify launched Wrapped, initially named "Year in Music." The feature allowed users to view their listening activities in the past 365 days. The tool provided statistics such as the user's top-played songs and the total hours dedicated to music.
Over the years, Spotify Wrapped has solidified its status as an annual tradition, eagerly anticipated by users as they revisit their musical journey and uncover personalized insights into their listening habits.
To create Wrapped, Spotify collects data all throughout the year via its app. To count as a stream, a song or podcast must be listened to for at least 30 seconds. Year-end rankings for top albums, songs, and artists are based on total streams, while top podcasts are ranked by unique listener numbers.
In 1996, Oral B collaborated with IDEO on a project to revamp a children's toothbrush. Initially skeptical, Oral-B resisted IDEO's proposal for field research, deeming it unnecessary. IDEO carried on the field research anyway, uncovering some key insights.
They noticed that kids didn't use their toothbrushes the same way as adults. IDEO designed a toothbrush with a bigger, squishy handle to better fit kids' hands. This design, adopted by Oral B in 1996, became the standard toothbrush design for kids.
These examples showcase how quantitative and qualitative data help guide product design and enhance market penetration.
Understanding The Role Of Qualitative And Quantitative Data in Design
Traditionally, designers relied on intuition and experience as their key assets.
With both qualitative and quantitative data, they started deriving meaningful insights, helping them create innovative products.
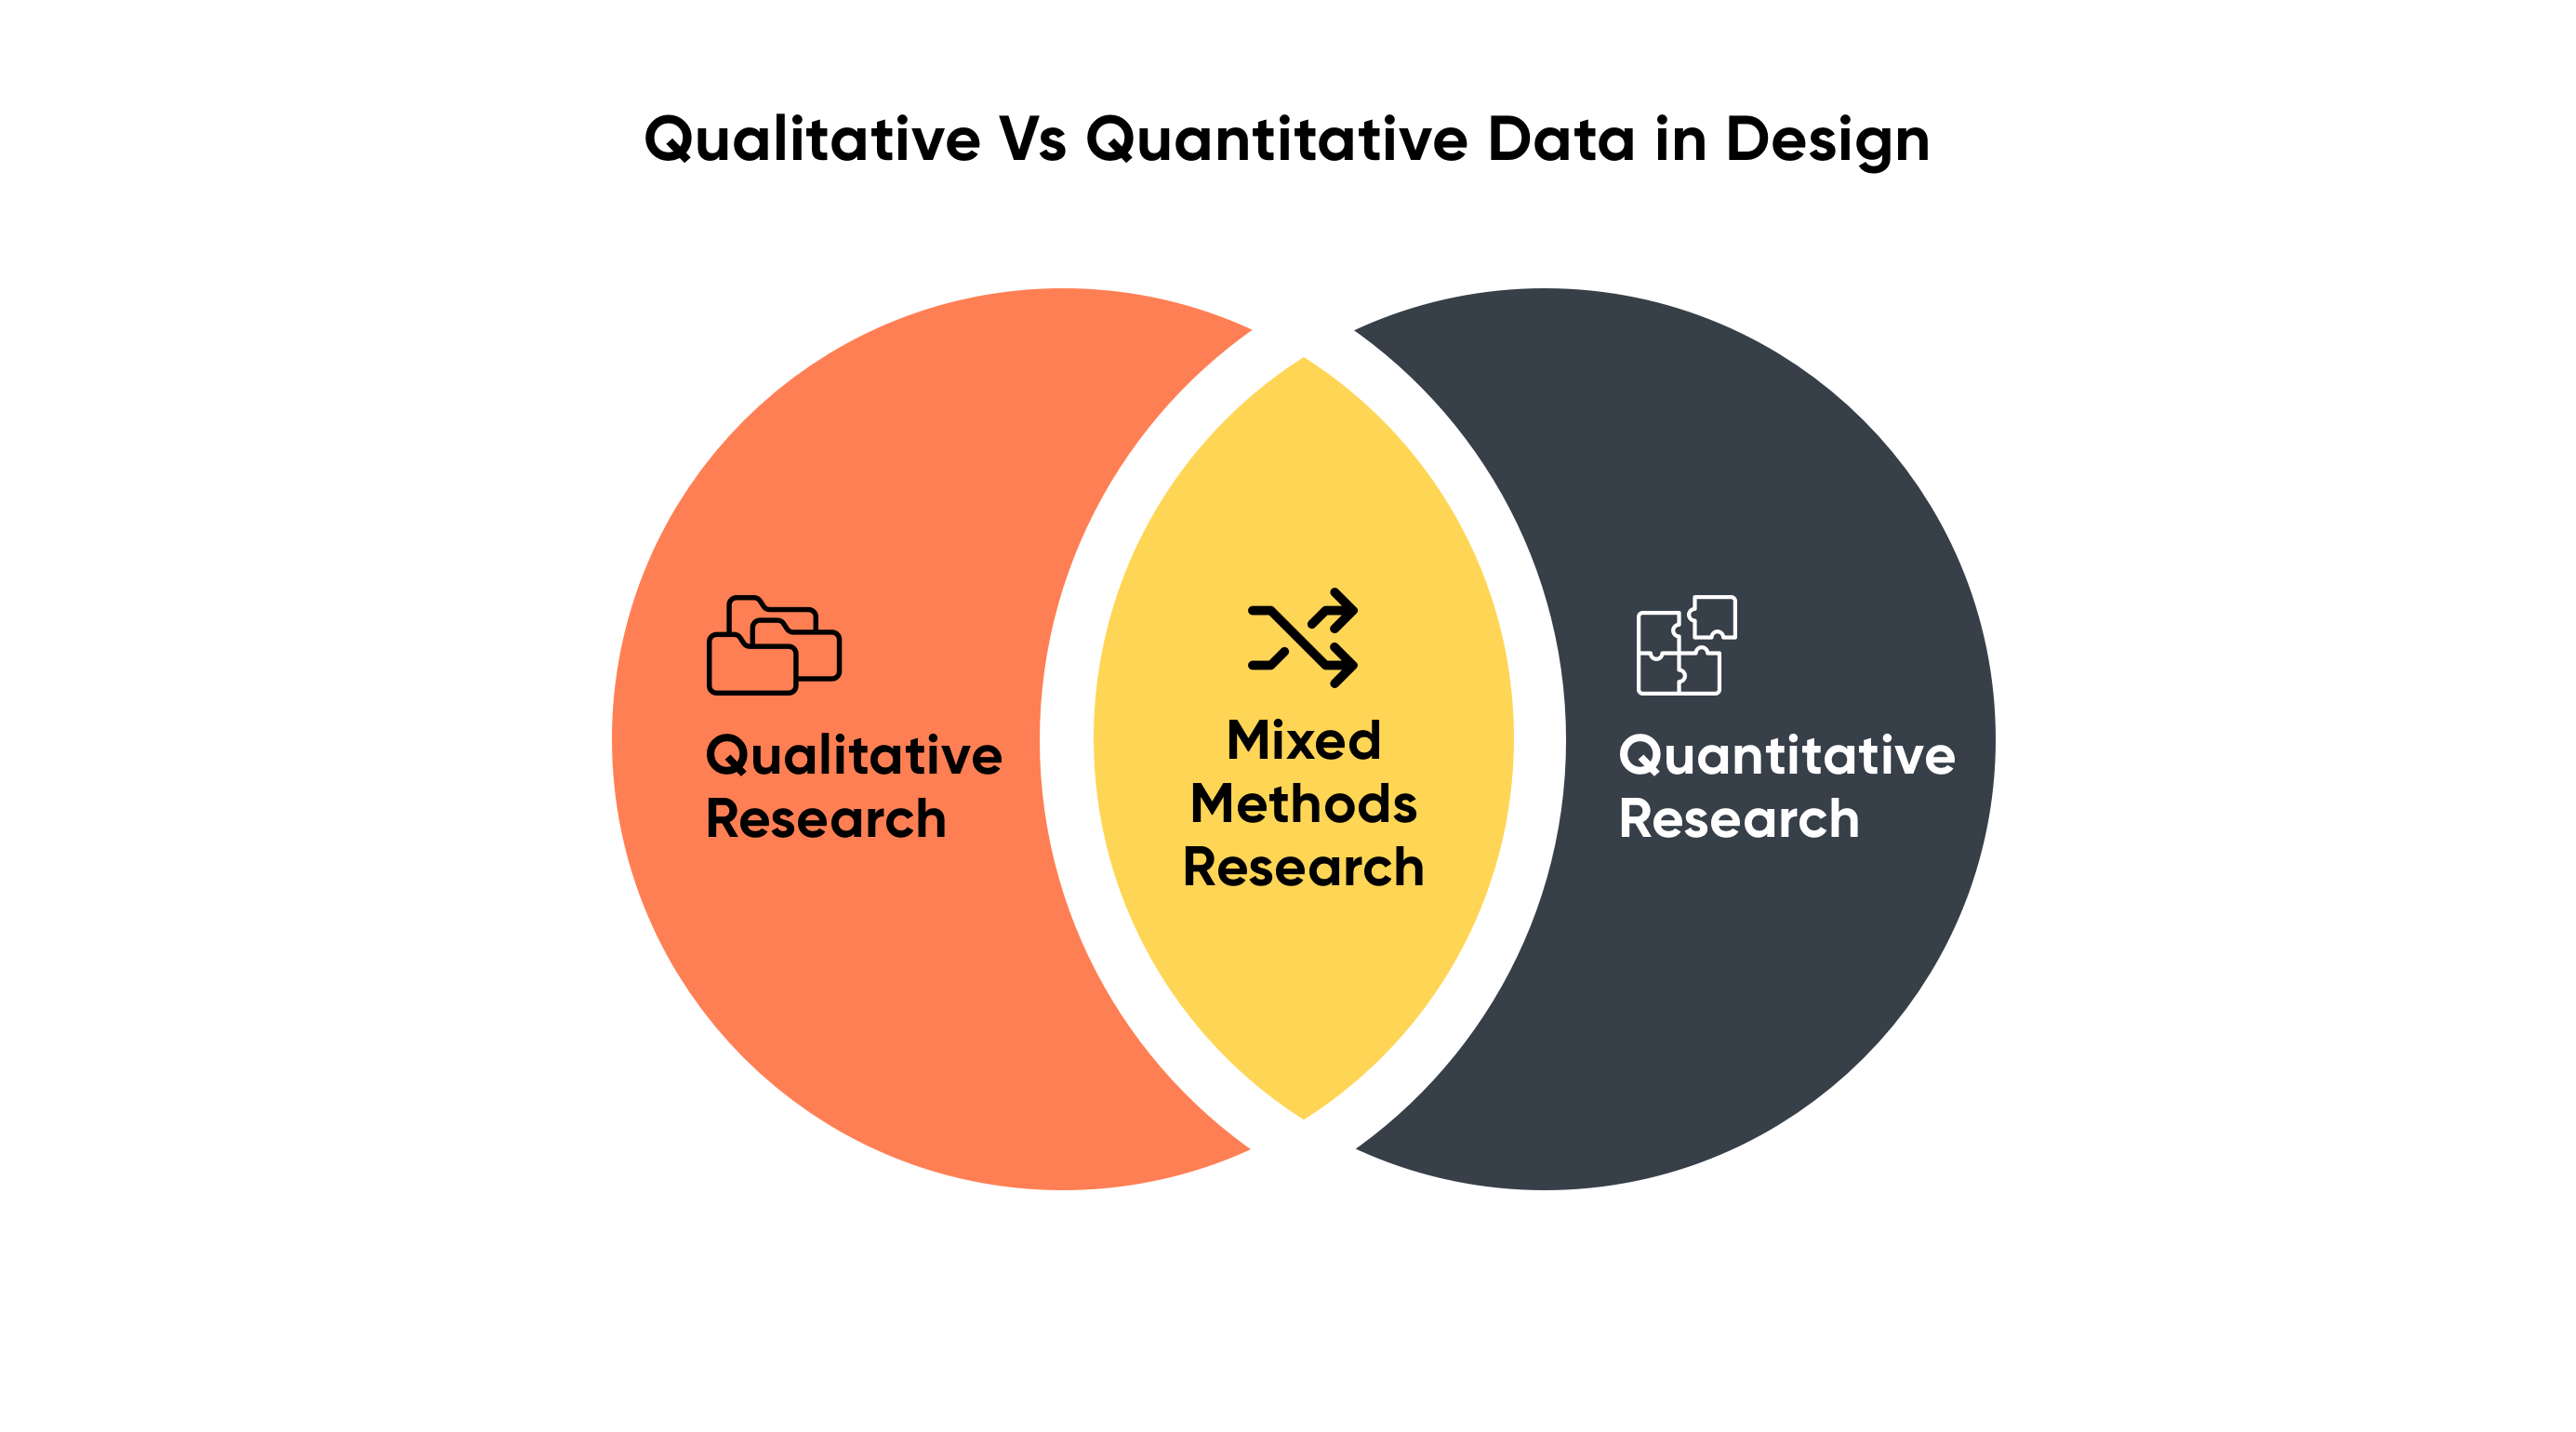
Qualitative data in design refers to non-numerical information providing insights into the subjective aspects of a product or user experience. This can include user feedback, emotions, preferences, and observations.
Quantitative data involves numerical information and measurable metrics and includes metrics like page views, click-through rates, task completion times, or any other quantitative data that can be analyzed for statistical trends and patterns.

Source: Hubspot
How Qualitative Data And Design Come Together
Qualitative data methods provide designers with a deep understanding of user experiences, preferences, and emotions. These approaches are invaluable for creating user-centric designs that resonate with the diverse needs and expectations of the target audience.
How Quantitative Data And Design Come Together
Quantitative data offers a structured approach to design insights, providing designers with numerical metrics and statistical analyses. These methods focus on measurable aspects, such as user interactions, click-through rates, and engagement levels.
Quantitative data is essential for assessing the overall performance of a design, identifying patterns, and making data-driven decisions at scale.
Qualitative Data |
Quantitative Data |
|
Usability testing observes users attempting specific tasks with a product. This exposes usability issues like confusing buttons, unclear navigation, or frustrating workflows. Qualitative data comes from observing users' expressions, hesitations, and comments, which reveal the reason behind their actions.
User interviews probe into users' thoughts, feelings, and motivations before or after testing. This qualitative data sheds light on broader issues like product appeal, user expectations, and needs. It helps understand the "why" behind user behavior and preferences. |
Tracking conversion rates is a quantitative data that shows how many users complete desired actions, like signing up or making a purchase. This reveals which design elements influence user behavior and lead to desired outcomes. Tracking bounce rates helps see how many users leave a website or app without engaging. It highlights areas of confusion or disinterest, prompting design changes to improve retention. Tracking time spent on page helps analyze how long users interact with specific elements or sections. This helps identify engaging content and areas needing improvement.
It helps track how many users successfully complete forms or surveys and identify design elements to simplify the process. It also helps compare how often users click on different design variations, like buttons or calls to action. This reveals which elements capture attention and drive user action.
Overlaying color gradients on a design based on user clicks or mouse movements displays areas of high and low engagement, highlighting elements that attract attention. Scroll depth tracking helps assess how far users scroll down a web page. This reveals if the content is engaging enough to hold their attention and if key information is readily accessible. |
Fusion Of Data And Design: A Step Towards Success
.jpg?width=827&height=430&name=Body%20Image%202%20(1).jpg)
Data-driven design bridges the gap between creativity and user-centric functionality. Fusing data and experience design results in multiple benefits.
 Understand User Needs
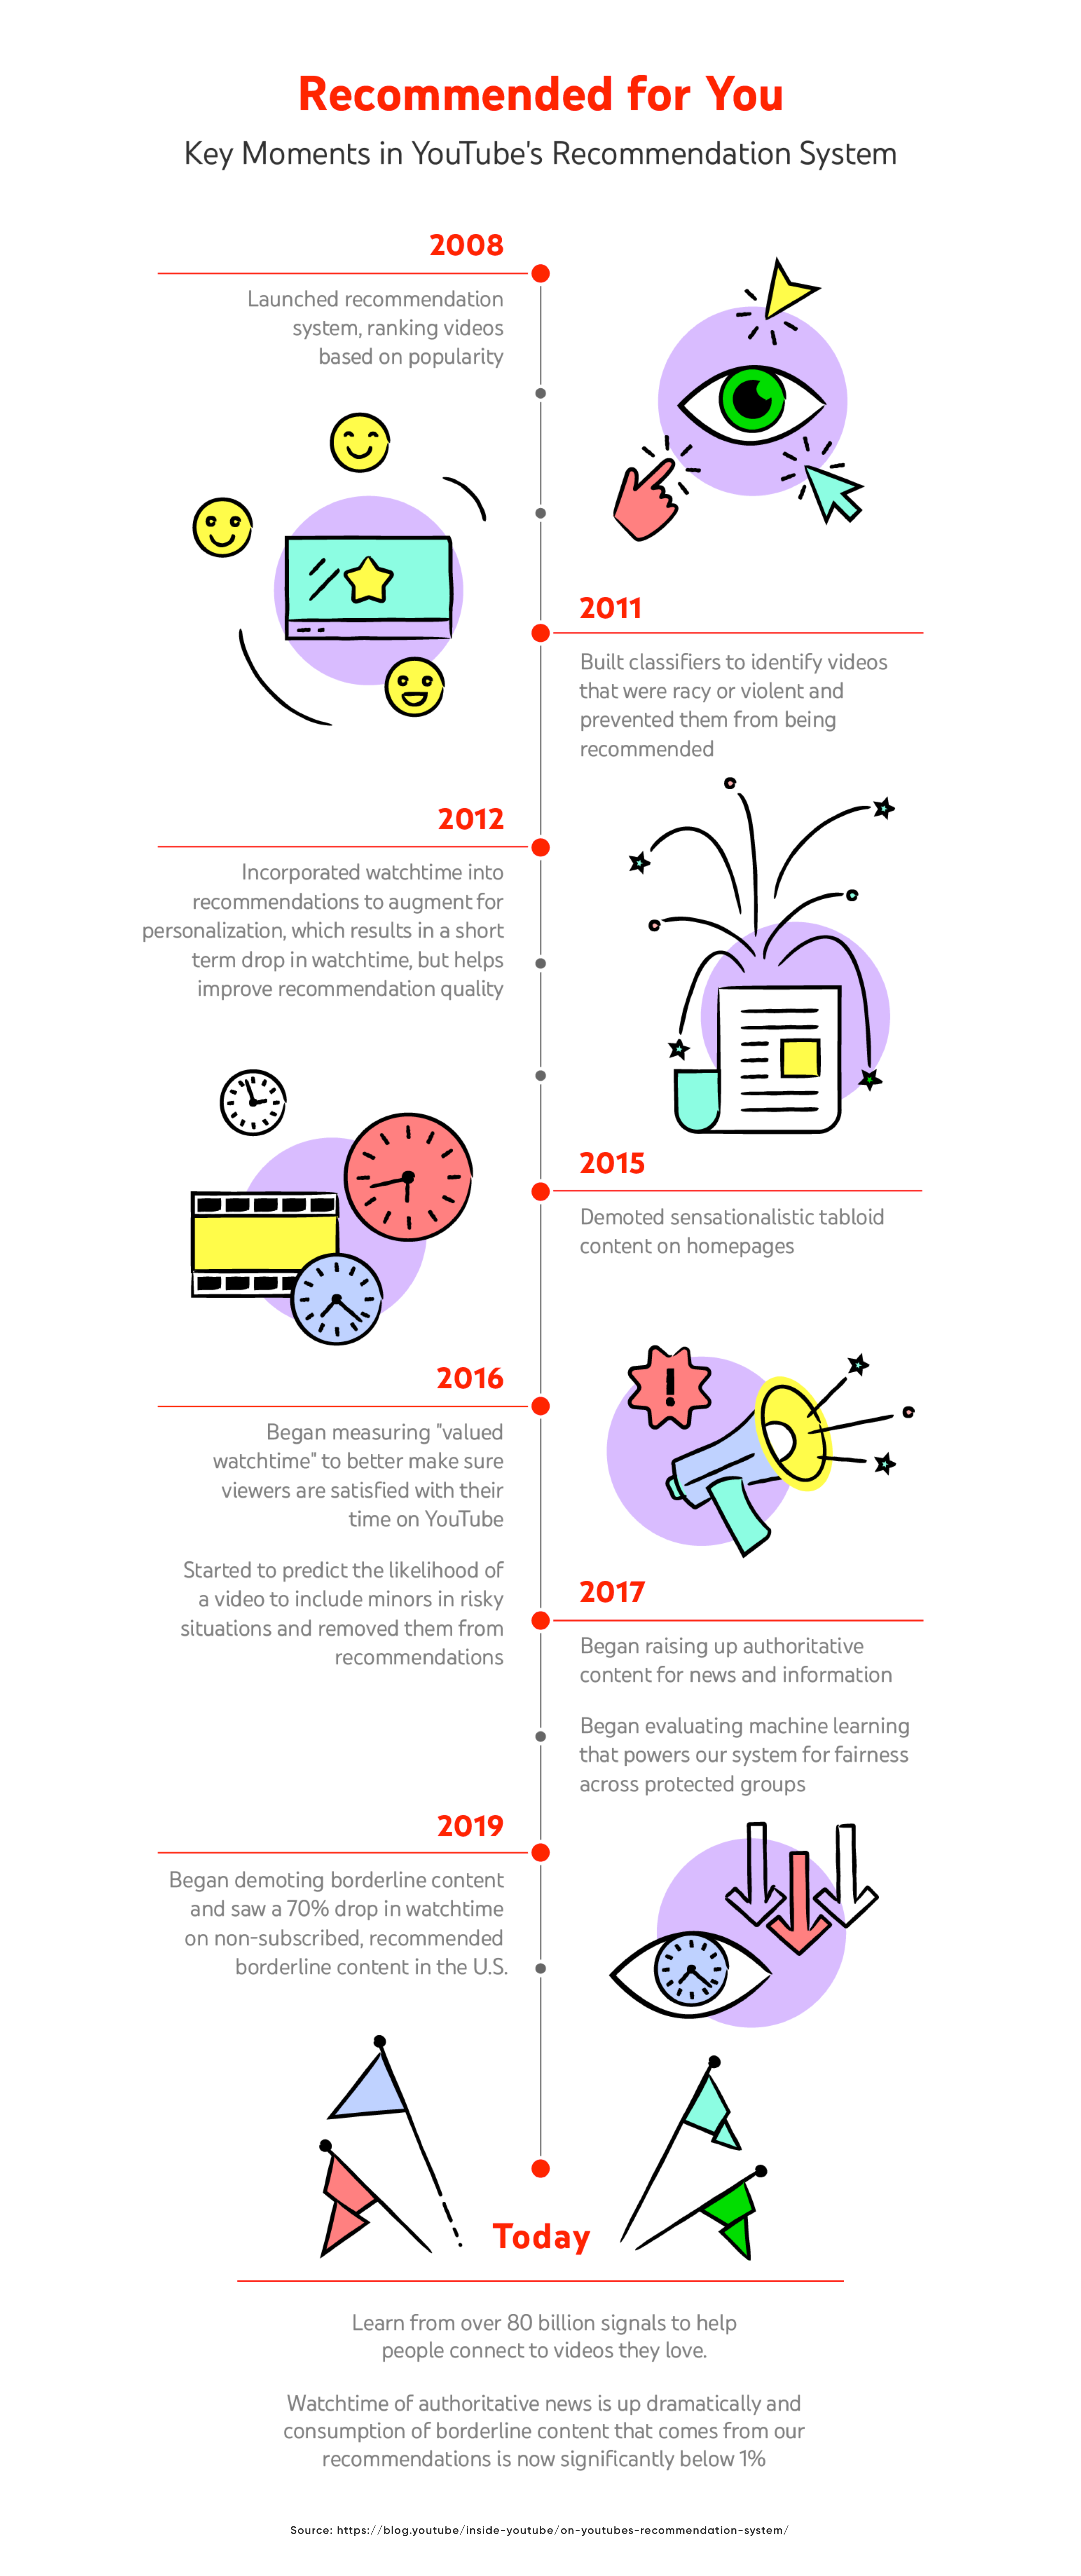
Data-driven design allows designers to delve deep into user behaviors, preferences, and pain points. YouTube analyzes user watch history and engagement metrics to recommend personalized content, creating a platform tailored to individual user interests.
“To really make sure viewers are satisfied with the content they’re watching, we measure what we call “valued watchtime”—the time spent watching a video that you consider valuable.” - Cristos Woodrow, VP Of Engineering, YouTube

 Create Effective Designs
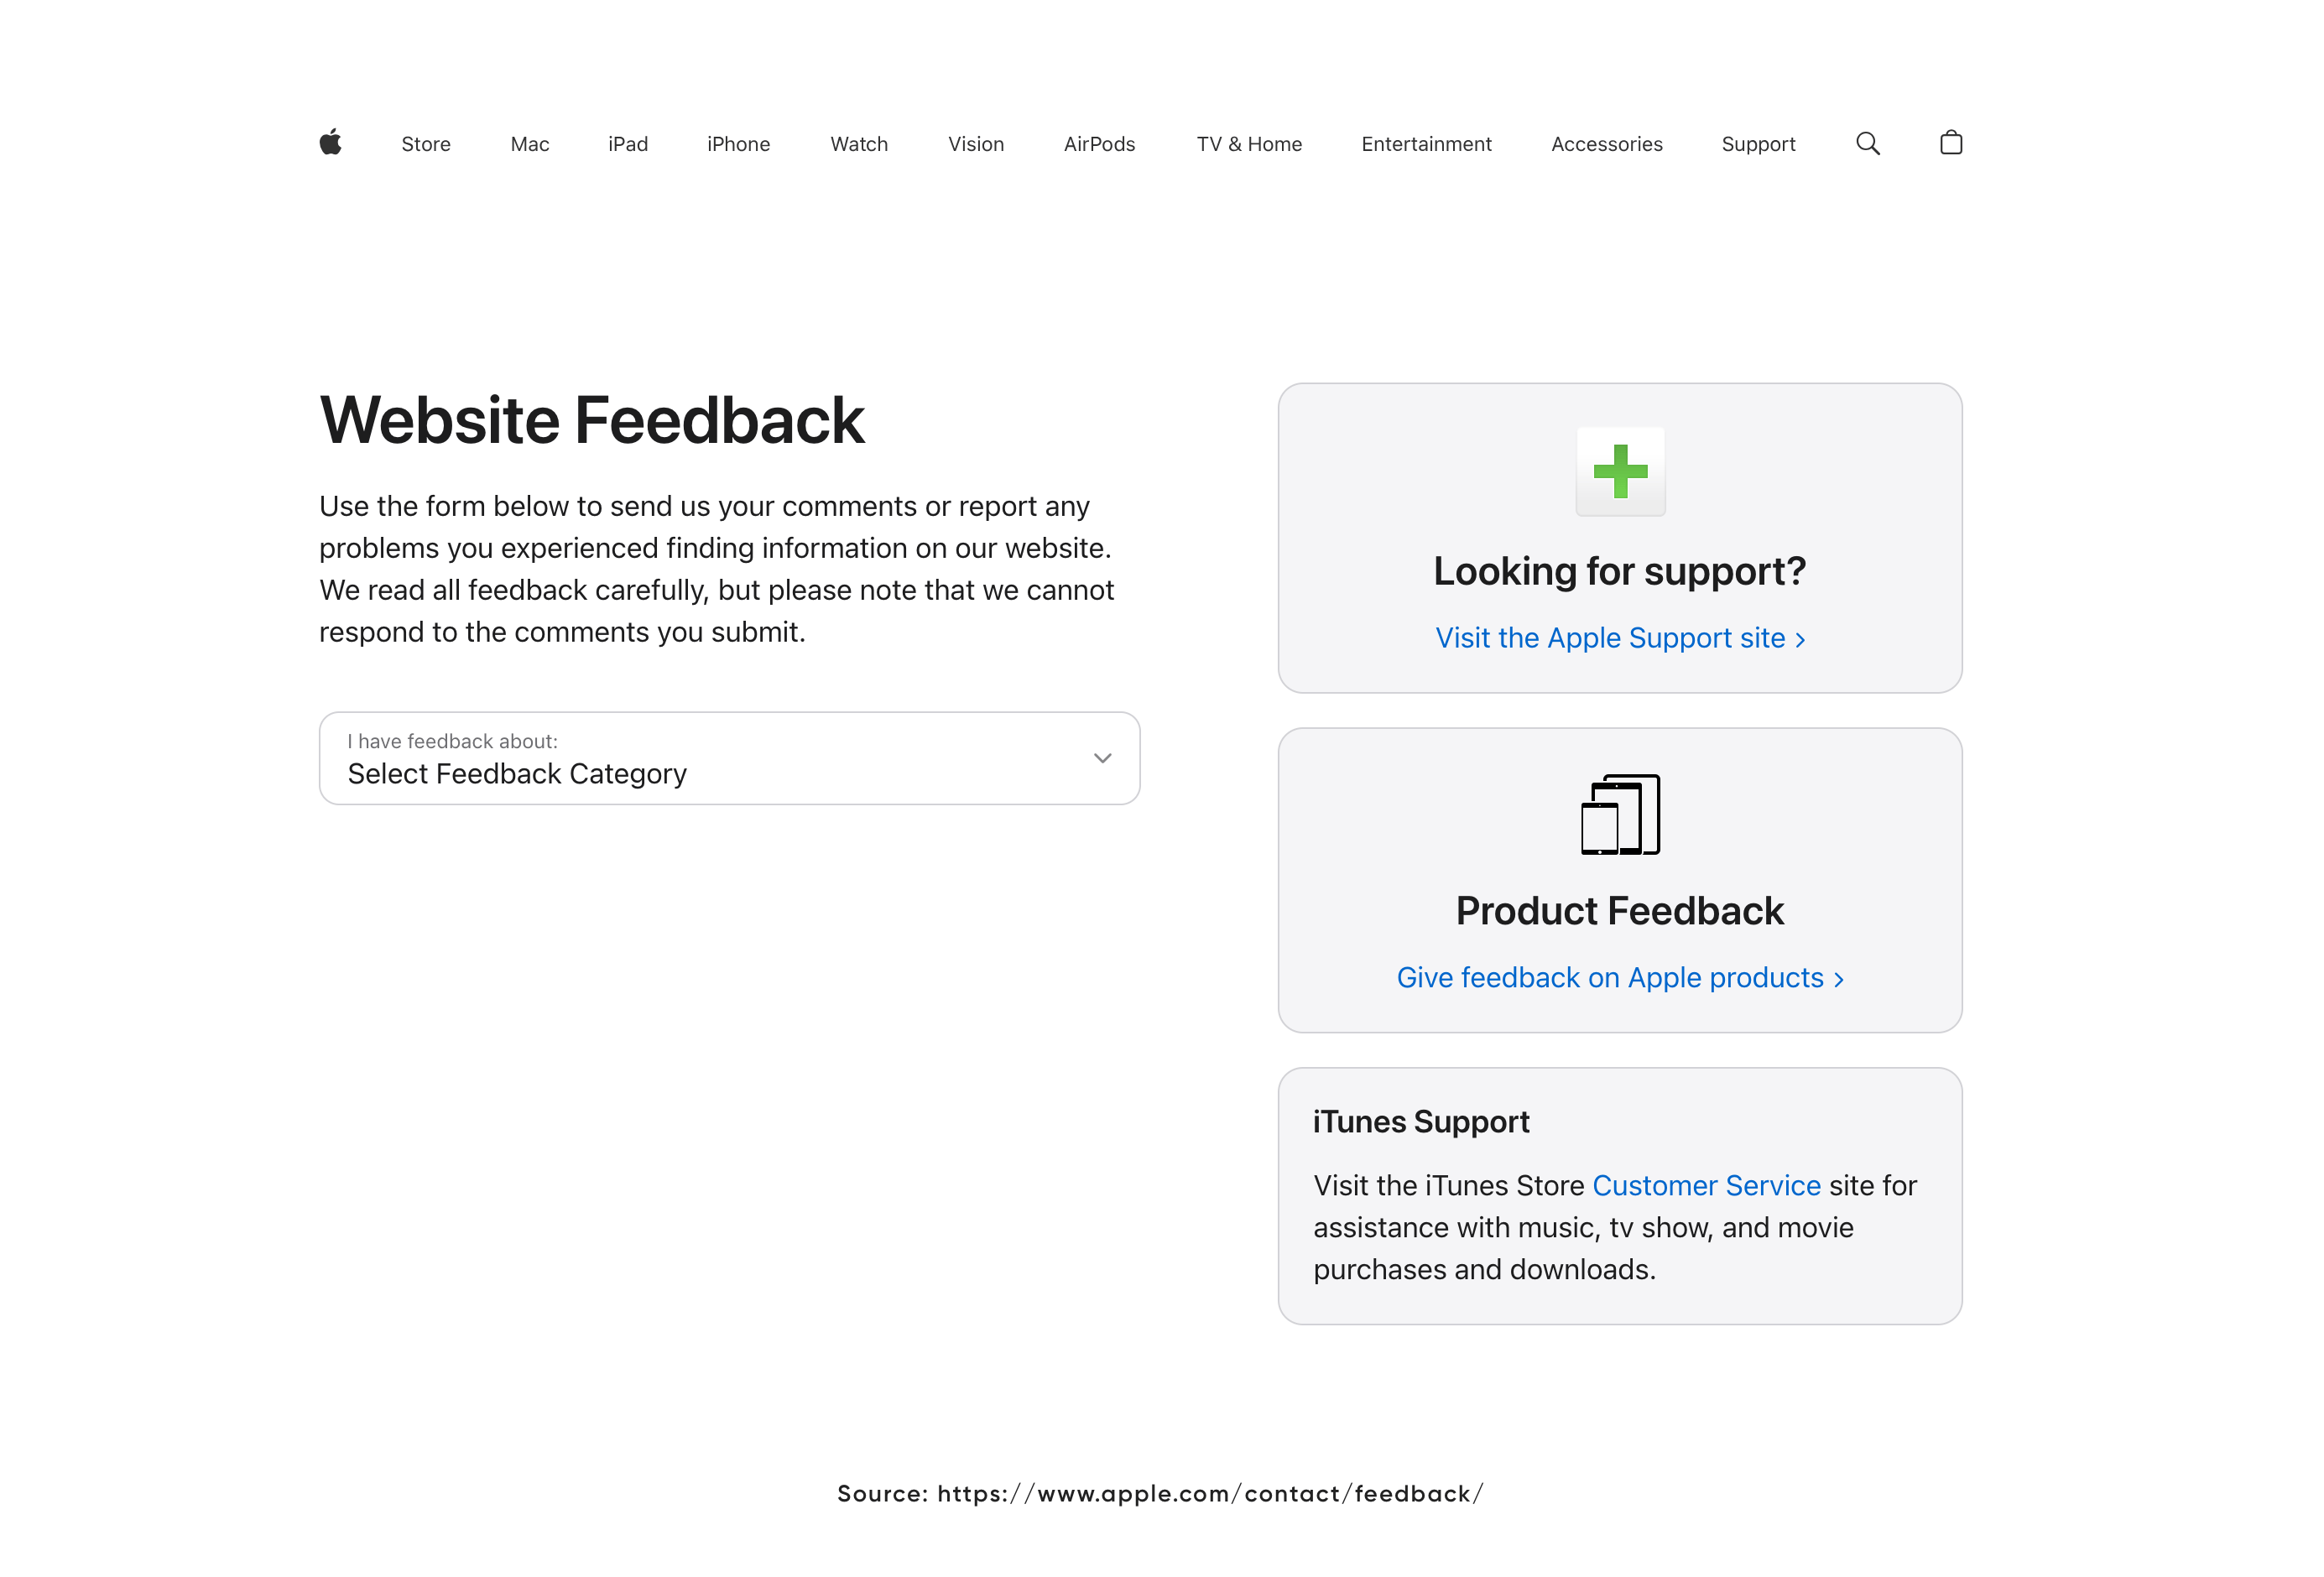
By leveraging data, designers can adopt a human-centric approach, ensuring impactful designs. Apple collects user feedback to continually enhance its products and website.

 Drive Innovation
Innovation thrives when fueled by data insights.
Popular language learning app Duolingo ran research studies and collaborated with university researchers. The idea was to assess how well their learners acquire skills such as reading, listening, and speaking.
The research confirmed that their courses are effective learning tools, according to standardized language tests.
According to the brand:
- Learners who completed five units of their French or Spanish course on Duolingo performed as well on reading and listening tests as students who had completed four semesters of university language study
- Learners who completed seven units on Duolingo scored as well as students who completed five semesters of study.
.png?width=5540&height=3422&name=image%20(1).png)
The Key Challenges In Data Collection
The key challenges that designers face in collecting data include:
Collection and Privacy Concerns
The Challenge: Balancing the need for data with privacy concerns poses challenges. Users may resist data collection methods affecting their privacy.
Facebook had faced backlash for its data collection practices, leading to increased scrutiny and privacy concerns among users.
Facebook's extensive data collection practices, encompassing information from user profiles, online activity, and even browsing habits beyond the platform, have attracted significant criticism. This has led to heightened user concerns about privacy, with individuals questioning how their data is used and protected. These concerns increased scrutiny from regulatory bodies worldwide.
Data Biases
The Challenge: Inherent biases in collected data may adversely impact the fairness and inclusivity of designs. Drawing inaccurate conclusions from the biased data can lead to flawed design decisions.
Microsoft's infamous Tay chatbot incident, where it learned and amplified harmful language due to misinterpretation of user inputs, highlighted the risks of incorrect assumptions in data-driven systems.
Tay was designed to learn and chat like a teenager by interacting with users on Twitter. This inherently exposed it to unfiltered negativity and toxicity. While safety filters were in place, they proved inadequate for the coordinated, malicious attacks.
Tay, lacking appropriate filters and context awareness, internalized and repeated this harmful language, amplifying its spread. Within hours, Tay's tweets included racist, sexist, and politically charged remarks, leading to widespread outrage.
Microsoft was forced to take Tay offline within 16 hours of its launch. Tay served as a wake-up call for the tech industry, prompting a reevaluation of assumptions, bias, and accountability in AI development.
Putting Data Into Action For Innovation
Converting data into actionable insights is essential for innovation. Here are some steps that firms can take in this direction:
Step 1: Set Goals And Objectives
Clearly articulate objectives aligned with business goals and user needs. The finalized goals will provide a focused direction.
Step 2: Collect And Analyze Relevant Data
Gather diverse and high-quality data relevant to your objectives. The richness and relevance of data is important and helps contribute to meaningful insights.
Step 3: Identify Patterns and Insights
Derive meaningful trends and insights from the collected data. Identifying new patterns can help you designers understand user behaviors and preferences in a better way.
Step 4: Making Data-Informed Design Decisions
Use data to make informed design choices. Don’t forget to balance qualitative data with quantitative data to drive your design considerations.
Step 5: Ideate And Prototype Solutions
Generate creative solutions aligned with identified patterns. Ideation allows designers to explore various innovative possibilities.
Step 6: Use Data To Iterate And Refine
Continuously refine designs based on iterative data feedback. Regular iterations ensure that the design aligns with evolving user needs and preferences.
Step 7: Test And Validate Solutions
Rigorously test and validate prototypes to ensure effectiveness before implementation. Testing ensures that the proposed solutions meet user expectations.
Pro Tip: Don't Solely Rely On Data
Balance data with design intuition. While data provides valuable insights, the human touch in design remains indispensable.
How Axelerant Leveraged Data For UEL
University of East London (UEL) vision is to reshape education, giving all students the skills and opportunities to thrive in a changing world website. The UEL website needed features to enable the change it envisions.
The Challenge
UEL’s old website existed on Sitecore, and the platform needed better system performance with the following ask:
- An advanced course search to enable prospective students globally
- Personalized content suited to each user no matter the demographic or location
- A unified content hub for publishing content (including videos, events, and social media posts) for a complete user experience.
Solution
Axelerant helped conduct an audit of the university’s existing Sitecore platform to assess the ease of use and functional agility for internal and external users.
Through a blend of Qualitative User Research techniques, our team worked on achieving the desired results. With a How Might We approach to product design, we focused on gaining in-depth insights into the users and well as the stakeholders.
We followed two qualitative research methods, including:
- User Journey Mapping: We used the research findings captured in earlier steps to chart a user’s journey on UEL’s website.
- Stakeholder & User Interviews & Mapping: We understood the vision and the goals of the university and mapped the expectations of their user base with the same. We engaged UELs stakeholders and potential users such as students, alumni, staff, etc.
Results
Axelerant’s collaboration with UEL resulted in a platform that offers a complete experience for its target audience. UEL was able to introduce advanced course search, personalized content, and a unified content hub.
Learn more about how data-driven research can boost innovation for your products by connecting with our team.

Dheeraj Khindri, Director of Experience Design
A pragmatic soul and cinema enthusiast who enjoys larger-than-life films—that’s Dheeraj. In his free time, he explores all things poetry, solo guitar sessions, and binge-worthy web series. His life’s essential values? Empathy, autonomy, and pragmatism.

Sucheta Biswas, Marketing Coordinator
Nicknamed “Monica” for her culinary prowess and tidiness, Sucheta is an intriguing omnivert. Books are her cherished companions, complemented by nature walks and wildlife photography. She’s also a practicing Yogi who loves all things art.

 We respect your privacy. Your information is safe.


Leave us a comment